
How Many People Visited the Appalachian Trail in 2025?
The Appalachian National Scenic Trail (A.T.) is one of the world’s most remarkable long-distance footpaths—stretching nearly 2,200 miles across 14 states. The Appalachian Trail Conservancy (ATC) and the National Park Service (NPS) teamed up to calculate the first annual visitation data for the A.T. in 2025.
16.9 million
Recreation Visits to the Appalachian Trail in 2025
#9
Most Visited National Park Unit*
2,197.9
Miles of Footpath
*According to the NPS’s Annual Park Ranking Report of 400+ units. Approximately one-third of the A.T. is on NPS lands, and 36% of the 2025 recreation visits were on sections managed by the NPS. The rest of the Trail is on USDA Forest Service land and public lands managed by state agencies and local townships.
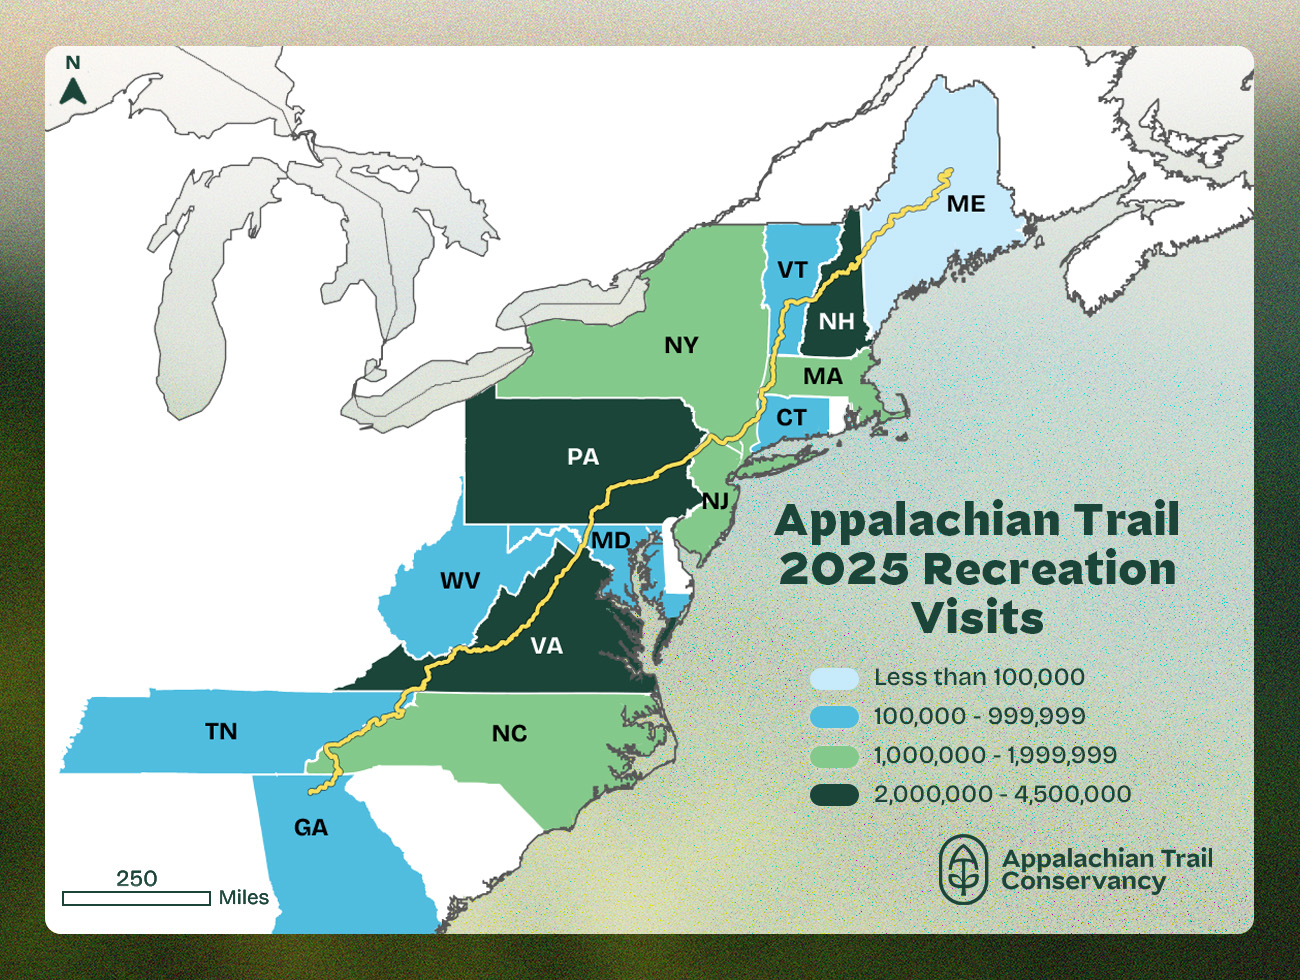
Visitation by State
| Number of Recreation Visits** | Percentage of Total Visits | |
|---|---|---|
| Virginia | 4,306,369 | 23.7% |
| New Hampshire | 2,879,020 | 15.8% |
| Pennsylvania | 2,702,091 | 14.9% |
| New York | 1,604,469 | 8.8% |
| North Carolina | 1,523,824 | 8.4% |
| Massachusetts | 1,075,575 | 5.9% |
| New Jersey | 1,037,730 | 5.7% |
| Georgia | 643,738 | 3.5% |
| Connecticut | 535,327 | 2.9% |
| Vermont | 532,805 | 2.9% |
| Maryland | 518,594 | 2.9% |
| Tennessee | 477,349 | 2.6% |
| West Virginia | 274,164 | 1.5% |
| Maine | 84,548 | 0.5% |
**The sum of the state recreation visits exceeds the total A.T. recreation visits because some visitors will hike in more than one state in a day and be counted once in each state. For example, a visitor hiking from the Carvers Gap to US-19 East would cross over the NC/TN border multiple times and contribute one visit to each state.
Busiest A.T. States


Quietest A.T. States


How We Estimate Visitation on the A.T.
The Appalachian Trail Conservancy and National Park Service use modern, privacy protected mobile location data alongside on-the-ground visitor counts to provide the most accurate Trailwide A.T. visitation estimate ever produced. We partnered with Placer.ai to estimate visitation using a three step process:
- Scientific modeling: Built using data from locations with known visitor counts (such as trail counters).
- Anonymous mobile data: Aggregated, deidentified smart phone signals help estimate how many people are on the Trail—no names or device IDs are ever collected. The mobile data is provided by Placer.ai, a privacy-first company.
- Trailwide scaling: The model applies across all miles of the A.T. to estimate total recreation visits.
What Counts as a Visit?
A “recreation visit” is one person spending 30+ minutes on the A.T. in a single day for the purpose of recreating. Multi-day visitors are counted once per day. Staff, contractors, commuters, and other coincidental users are excluded.
Challenges with Calculating A.T. Visitation
With hundreds of access points and no designated entrances and exits like many other national parks, counting how many people visit the Trail each year has been a challenge. Additionally, the A.T. is managed at the ground level by many different state and federal agencies. These factors make traditional counting methods—such as volunteer reports or isolated trail counters—useful but incomplete.
Privacy is Protected and Prioritized
All mobile data used are aggregated and deidentified. No personal information—names, device IDs, phone numbers, or contact data—is ever collected or stored. Only broad visitation patterns—not individual behavior—are analyzed. Learn more about Placer.ai’s commitment to data privacy.
Why These Estimates Matter
Understanding visitation helps the ATC, the A.T. Clubs, and federal, state, and local A.T. land managers:
Identify heavily visited areas that may need more attention.
Have a more accurate estimate of day hiker use and compare day hiker use to long-distance hiker use.
Protect natural resources and the A.T. hiking experience.
Improve visitor education and safety.
Strengthen partnerships and funding requests.
Measure the impact of stewardship and volunteer programs.